15 Mar 2021
This semester I’m a Teaching Assistant for MIT’s 6.824 Distributed Systems class. The class requires students to iteratively implement Raft, a distributed consensus protocol. This is a very challenging task, as despite Raft’s claim to fame as an “easier to understand Paxos”, Raft is a complex distributed system that is quite hard to get right, even after several (or many) attempts. When I took 6.824, I noticed that the bottleneck for finishing the labs never was doing the bulk of the required implementation for the corresponding lab. Overall, what consumed most of my time was getting the failed runs and parsing through the logs to understand how the system failed and what went wrong.
In this post, I won’t go over common pitfalls or how a Raft implementation usually goes wrong, if you are interested in that, check out the fantastic Students’ Guide to Raft. What I’ll cover is how to write tools to make your life as a distributed systems debugger easier. We will see how to build these terminal-based tools from the ground up, ending with a debugging suite that will make you more efficient at detecting, understanding and fixing bugs for the 6.824 labs. All the labs in 6.824 are debugged in the same way, so it’s probably a good idea to invest some time in making collecting and parsing logs less laborious.
Debugging distributed code hits different
Debugging distributed systems is a task many students have not dealt with before taking 6.824, and it’s fundamentally different from other forms of debugging. There are no easily accessible debuggers like gdb or pdb that let you run your code step by step. And traditional printf debugging also falls short since there can be a large amount of routines running (and thus, printing) in parallel.
In traditional systems, debugging via print statements is fairly straightforward, since there is often a single thread of execution and one can quickly reason about what is going on.
With distributed systems like the ones in the 6.824 labs, there are N machines and each of them is concurrently executing several threads. For instance, in the Raft labs there are N raft peers executing in parallel as if they were in separate machines. For each one of these peers there will be multiple goroutines executing in parallel (commonly one or two timers, an applier and some amount of RPC and RPC reply handlers), leading to large amounts of concurrency. While adding print statements is easy, parsing through them can be quite tricky, specially as the complexity of the labs slowly builds up week after week.
All that said, going through your logs to identify the faults in your logic is the best bang for your buck pset hour. Staring at your code or repeatedly tweaking different parts might help in the short term, but hard bugs will require a more careful analysis.
Moreover, in a system like Raft not only there are multiple threads printing output at once, but they will be printing about very heterogeneous events such as: timer resets, log operations, elections, crash recovery or communication with the replicated state machine. Crucially, different types of events will occur with different frequencies, which can lead to overly verbose logs if they are not trimmed in some way.
Therefore, we would ideally like to know who is printing each line and what topic the message is related to. Our goal is to design a way of encoding those pieces of information visually. TL;DR: We will make Go print a boring log with a specific format and then make use of the Rich Python library to abstract away the ugly complexity of printing beautifully formatted terminal output.
The Go side
While most of the tooling will be done using Python scripts, there needs to be some cooperation from the Go side to ensure that we feed the information to downstream scripts in a way that is easy to parse.
Toggling the output verbosity.
A minor quality of life improvement that I implemented is the ability to toggle log verbosity without having to edit go code at all. Later on, this will also make it easier for our automated script runner to control verbosity.
Since the 6.824 tests use go test, we can’t use command line arguments directly. However, what we can use are environment variables. The following piece of code will access the VERBOSE environment variable to decide whether verbose logs are needed.
// Retrieve the verbosity level from an environment variable
func getVerbosity() int {
	v := os.Getenv("VERBOSE")
	level := 0
	if v != "" {
		var err error
		level, err = strconv.Atoi(v)
		if err != nil {
			log.Fatalf("Invalid verbosity %v", v)
		}
	}
	return level
}
Logging with topics. I decided to fundamentally alter my printf function of choice to accept as a first argument a topic that encodes what category the message belongs to. This first argument is in essence a string, but to make code easier to refactor (and because I dislike typing quotes), I declared the topic as constants. The topics relate to different parts of the implementation, and by making them fine grained we will able to filter, search and even highlight them with different colors.
type logTopic string
const (
	dClient  logTopic = "CLNT"
	dCommit  logTopic = "CMIT"
	dDrop    logTopic = "DROP"
	dError   logTopic = "ERRO"
	dInfo    logTopic = "INFO"
	dLeader  logTopic = "LEAD"
	dLog     logTopic = "LOG1"
	dLog2    logTopic = "LOG2"
	dPersist logTopic = "PERS"
	dSnap    logTopic = "SNAP"
	dTerm    logTopic = "TERM"
	dTest    logTopic = "TEST"
	dTimer   logTopic = "TIMR"
	dTrace   logTopic = "TRCE"
	dVote    logTopic = "VOTE"
	dWarn    logTopic = "WARN"
)
The print function. The last moving piece on the Go side is the actual print function we will use to dump output. I called mine Debug and it prints the message along with the topic and the amount of milliseconds since the start of the run. I disable all datetime logging since that information is quite redundant (all tests must pass in at most a couple of minutes). Moreover, printing just the milliseconds renders useful when checking that timer-related events happen with the expected frequency.
var debugStart time.Time
var debugVerbosity int

func init() {
	debugVerbosity = getVerbosity()
	debugStart = time.Now()

	log.SetFlags(log.Flags() &^ (log.Ldate | log.Ltime))
}

func Debug(topic logTopic, format string, a ...interface{}) {
	if debug >= 1 {
		time := time.Since(debugStart).Microseconds()
		time /= 100
		prefix := fmt.Sprintf("%06d %v ", time, string(topic))
		format = prefix + format
		log.Printf(format, a...)
	}
}
A missing piece here is who is sending this message. I pass that directly as the first few characters when printing. For example
Debug(dTimer, "S%d Leader, checking heartbeats", rf.me)
So if we now run with verbosity (e.g. VERBOSE=1 go test -run TestBackup2B) the output will look something like the excerpt below.
...
008258 LOG2 S2 Saved Log (-1, 0) [{<nil> 0}]
008256 VOTE S3 Granting Vote to S1 at T1
008258 VOTE S1 <- S0 Got vote
008258 VOTE S4 Granting Vote to S1 at T1
008259 PERS S4 Saved State T:1 VF:1
008258 PERS S3 Saved State T:1 VF:1
008259 LOG2 S3 Saved Log (-1, 0) [{<nil> 0}]
008259 VOTE S1 <- S2 Got vote
008260 LEAD S1 Achieved Majority for T1 (3), converting to Leader
008260 TIMR S1 Broadcast, reseting HBT
008260 LOG1 S1 -> S0 Sending PLI: 0 PLT: 0 N: 0 LC: 0 - []
008260 LOG1 S1 -> S2 Sending PLI: 0 PLT: 0 N: 0 LC: 0 - []
008259 LOG2 S4 Saved Log (-1, 0) [{<nil> 0}]
008261 LOG1 S1 -> S3 Sending PLI: 0 PLT: 0 N: 0 LC: 0 - []
008262 LOG1 S1 -> S4 Sending PLI: 0 PLT: 0 N: 0 LC: 0 - []
008262 TIMR S1 Leader, checking heartbeats
008263 TIMR S0 Resetting ELT, received AppEnt T1
008263 TIMR S3 Resetting ELT, received AppEnt T1
008264 TIMR S2 Resetting ELT, received AppEnt T1
008264 LOG2 S2 LOG: (-1, 0) [{<nil> 0}]
...
So for every line, the first three columns indicate: when the event happened, what topic it’s related to and which server is printing the message. The rest is left as free form.
Prettifying the Logs
So far, the output logs are still looking rather bleak. They seem functional but they would be painful to toil through for hundreds of lines as you search for the sneaky bugs in your code. We will now write a log parser, filter and pretty printer in Python.
While Go is great language choice for the 6.824 labs, it is not as ergonomic as Python when it comes to quick and dirty scripting. A major reason why I decided to go with Python are Rich and Typer, a couple of nifty libraries that make writing Terminal User Interface (TUI) applications a breeze.
Humans are visual creatures so it’s a good idea to make use of visual tools like colors or columns to encode different types of information. Reducing the time to parse who said what will drastically improve your debugging efficiency. However, if you have ever tried pretty printing from the terminal you will probably have realized by now that it often feels like a chore and you end up writing very messy code. Here is where Rich comes to the rescue. According to their description “Rich is a Python library for rich text and beautiful formatting in the terminal”. If you quickly browse their docs you will probably be amazed at the multitude of features that Rich has to offer. I won’t go into a terrible amount of detail, but I highly encourage you to check out Rich if you build terminal Python scripts that need to present structured or interactive output.
For our case, Rich provides an intuitive API for dealing with printing colored output and formatting text into N columns.
For instance, rich.print("[red]This is red[/red]") will print that enclosed text to the terminal using ANSI escape codes, rendering the text red. When compared to its bash equivalent of doing echo -e "\033[91mThis is red\e[0m which looks more like nonsensical characters, the choice it’s obvious.
Using Rich’s primitives we can easily build our pretty printer for logs. The relevant snippet is below. Implementation is mostly commented, highlighting the different features of the script which include: topic filtering, topic-based colorization and column printing.
The full script can be found here. Setting up a Python environment with the required packages and adding the script to your PATH is left as an exercise for the reader.
# [...] # Some boring imports
# Mapping from topics to colors
# See the disclaimer at the end of the post if you
# want to use all RGB colors
TOPICS = {
    "TIMR": "bright_black",
    "VOTE": "bright_cyan",
    "LEAD": "yellow",
    "TERM": "green",
    "LOG1": "blue",
    "LOG2": "cyan",
    "CMIT": "magenta",
    "PERS": "white",
    "SNAP": "bright_blue",
    "DROP": "bright_red",
    "CLNT": "bright_green",
    "TEST": "bright_magenta",
    "INFO": "bright_white",
    "WARN": "bright_yellow",
    "ERRO": "red",
    "TRCE": "red",
}

# [...] # Some boring command line parsing

# We can take input from a stdin (pipes) or from a file
input_ = file if file else sys.stdin
# Print just some topics or exclude some topics
if just:
    topics = just
if ignore:
    topics = [lvl for lvl in topics if lvl not in set(ignore)]

topics = set(topics)
console = Console()
width = console.size.width

panic = False
for line in input_:
    try:
        # Assume format from Go output
        time = int(line[:6])
        topic = line[7:11]
        msg = line[12:].strip()
        # To ignore some topics
        if topic not in topics:
            continue

        # Debug() calls from the test suite aren't associated with
        # any particular peer. Otherwise we can treat second column
        # as peer id
        if topic != "TEST" and n_columns:
            i = int(msg[1])
            msg = msg[3:]

        # Colorize output by using rich syntax when needed
        if colorize and topic in TOPICS:
            color = TOPICS[topic]
            msg = f"[{color}]{msg}[/{color}]"

        # Single column. Always the case for debug calls in tests
        if n_columns is None or topic == "TEST":
            print(time, msg)
        # Multi column printing, timing is dropped to maximize horizontal
        # space. Heavylifting is done through rich.column.Columns object
        else:
            cols = ["" for _ in range(n_columns)]
            msg = "" + msg
            cols[i] = msg
            col_width = int(width / n_columns)
            cols = Columns(cols, width=col_width - 1,
                           equal=True, expand=True)
            print(cols)
    except:
        # Code from tests or panics does not follow format
        # so we print it as is
        if line.startswith("panic"):
            panic = True
        # Output from tests is usually important so add a
        # horizontal line with hashes to make it more obvious
        if not panic:
            print("-" * console.width)
        print(line, end="")
Armed with this script we can now put it into action
# You can just pipe the go test output into the script
$ VERBOSE=1 go test -run InitialElection | dslogs
# ... colored output will be printed

# We can ignore verbose topics like timers or log changes
$ VERBOSE=1 go test -run Backup | dslogs -c 5 -i TIMR,DROP,LOG2
# ... colored output in 5 columns

# Dumping output to a file can be handy to iteratively
# filter topics and when failures are hard to reproduce
$ VERBOSE=1 go test -run Figure8Unreliable > output.log
# Print from a file, selecting just two topics
$ dslogs output.log -j CMIT,PERS
# ... colored output
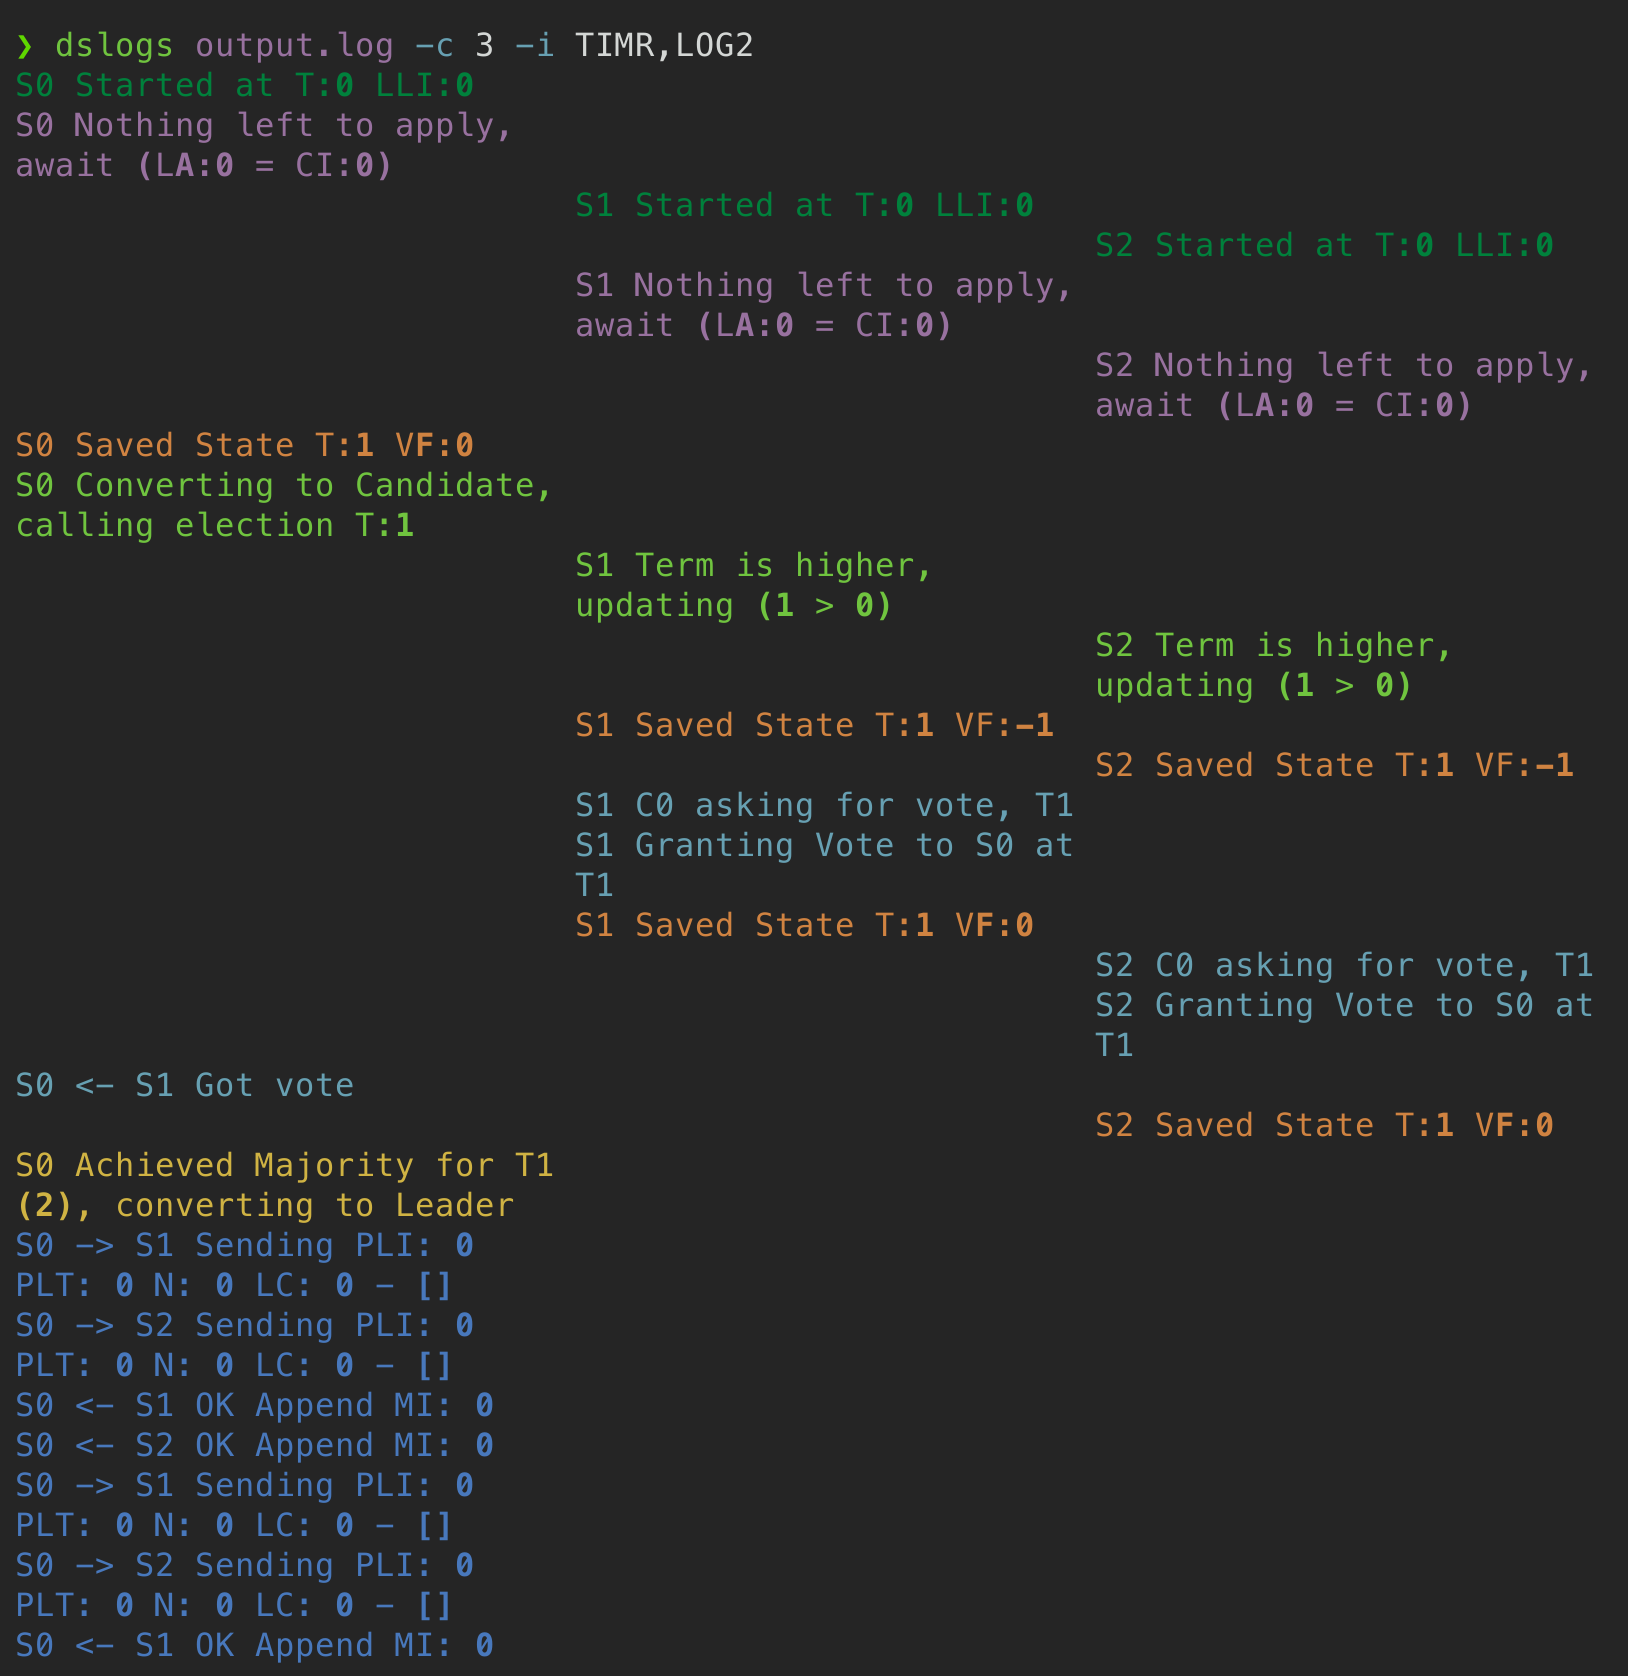
Since a picture is worth a thousand words, below is a comparison between a sample run for a simple test with and without the log prettifying. The raw output looks a bit daunting to parse:

After prettifying we’ve got a quite simple story: S0 becomes candidate, S1 and S2 update terms and vote for S0. S0 converts to leader and starts sending and receiving heartbeats.
Note, since some tests might produce thousands of lines of logs, it’s a good idea to use some sort of pager strategy to quickly navigate them. I am a happy tmux user and that’s what how I went about it. I do have in my .tmux.conf a history override (set -g history-limit 100000) so I have enough scrollback. Using less won’t work because it’ll mess with Rich’s ability to print colors and detect console width. You might try Rich’s console.pager() context manager although from cursory exploration I had to wait until the whole output was there for pagination to start.
Capturing Rare Failures
We now have a wonderful tool for examining logs. However logs for failed runs are sometimes hard to come by. What I’m referring to is the fact that as you progressively fix mistakes in your distributed system implementations, bugs will become rarer and it can become frustrating when all tests pass except for a specific one that only fails every fifty or hundred runs.
Ideally we would like a script that does the following:
- Executes N runs of a series of tests
- Saves failed runs for later inspection
- Runs tests in parallel.
The first two items are actually quite easy to achieve with some simple bash scripting as the following snippet shows:
#!/usr/bin/env bash

trap 'exit 1' INT

echo "Running test $1 for $2 iters"
for i in $(seq 1 $2); do
    echo -ne "\r$i / $2"
    LOG="$1_$i.txt"
    # Failed go test return nonzero exit codes
    go test -run $1 &> $LOG
    if [[ $? -eq 0 ]]; then
        rm $LOG
    else
        echo "Failed at iter $i, saving log at $LOG"
    fi
done
However, the previous script will only run one test at a time. Running tests in parallel speeds things up significantly, and it also sometimes helps by introducing more concurrency, leading to rare interleavings to happen more frequently.
Nevertheless, the concurrency property is significantly harder to achieve with bash scripting and this is where Python comes to the rescue once again. While Python has a quite complicated story for concurrency (specially when compared to Go), it does offer a pragmatic concurrency API through the concurrent.futures module. Thus, we can run N tests in parallel, wait until one (or more) complete and assign new tests to the idle workers. Furthermore, when assigning new tasks, we can cycle through test types, as if we were running them sequentially in a cyclical way.
Below is a snippet with the core functionality to achieve the desired behavior using Python. I’ve stripped the CLI parsing and UI updating parts. The full dstest script that I wrote can be found here. dstest --help will give you an idea of how to use it, but it is up to you to modify it and tailor to your needs.
# [...] Some boring imports

# concurrent.futures requires tasks that are encapsulated in a function
def run_test(test: str, race: bool):
    test_cmd = ["go", "test", f"-run={test}"]
    if race:
        test_cmd.append("-race")
    f, path = tempfile.mkstemp()
    start = time.time()
    proc = subprocess.run(test_cmd, stdout=f, stderr=f)
    runtime = time.time() - start
    os.close(f)
    return test, path, proc.returncode, runtime

# [...] # Some boring command line parsing and UI setup

# This will collate tests, so they run in a balanced way
tests = itertools.chain.from_iterable(itertools.repeat(tests, iterations))

with ThreadPoolExecutor(max_workers=workers) as executor:

    futures = []
    while completed < total:
        n = len(futures)
        # If there are fewer futures than workers assign them
        if n < workers:
            for test in itertools.islice(tests, workers-n):
                futures.append(executor.submit(run_test, test, race))

        # Wait until a task completes
        done, not_done = wait(futures, return_when=FIRST_COMPLETED)

        for future in done:
            test, path, rc, runtime = future.result()

            dest = (output / f"{test}_{completed}.log").as_posix()
            # If the test failed, save the output for later analysis
            if rc != 0:
                print(f"Failed test {test} - {dest}")
                output.mkdir(exist_ok=True, parents=True)
                shutil.copy(path, dest)

            os.remove(path)
            completed += 1
            futures = list(not_done)
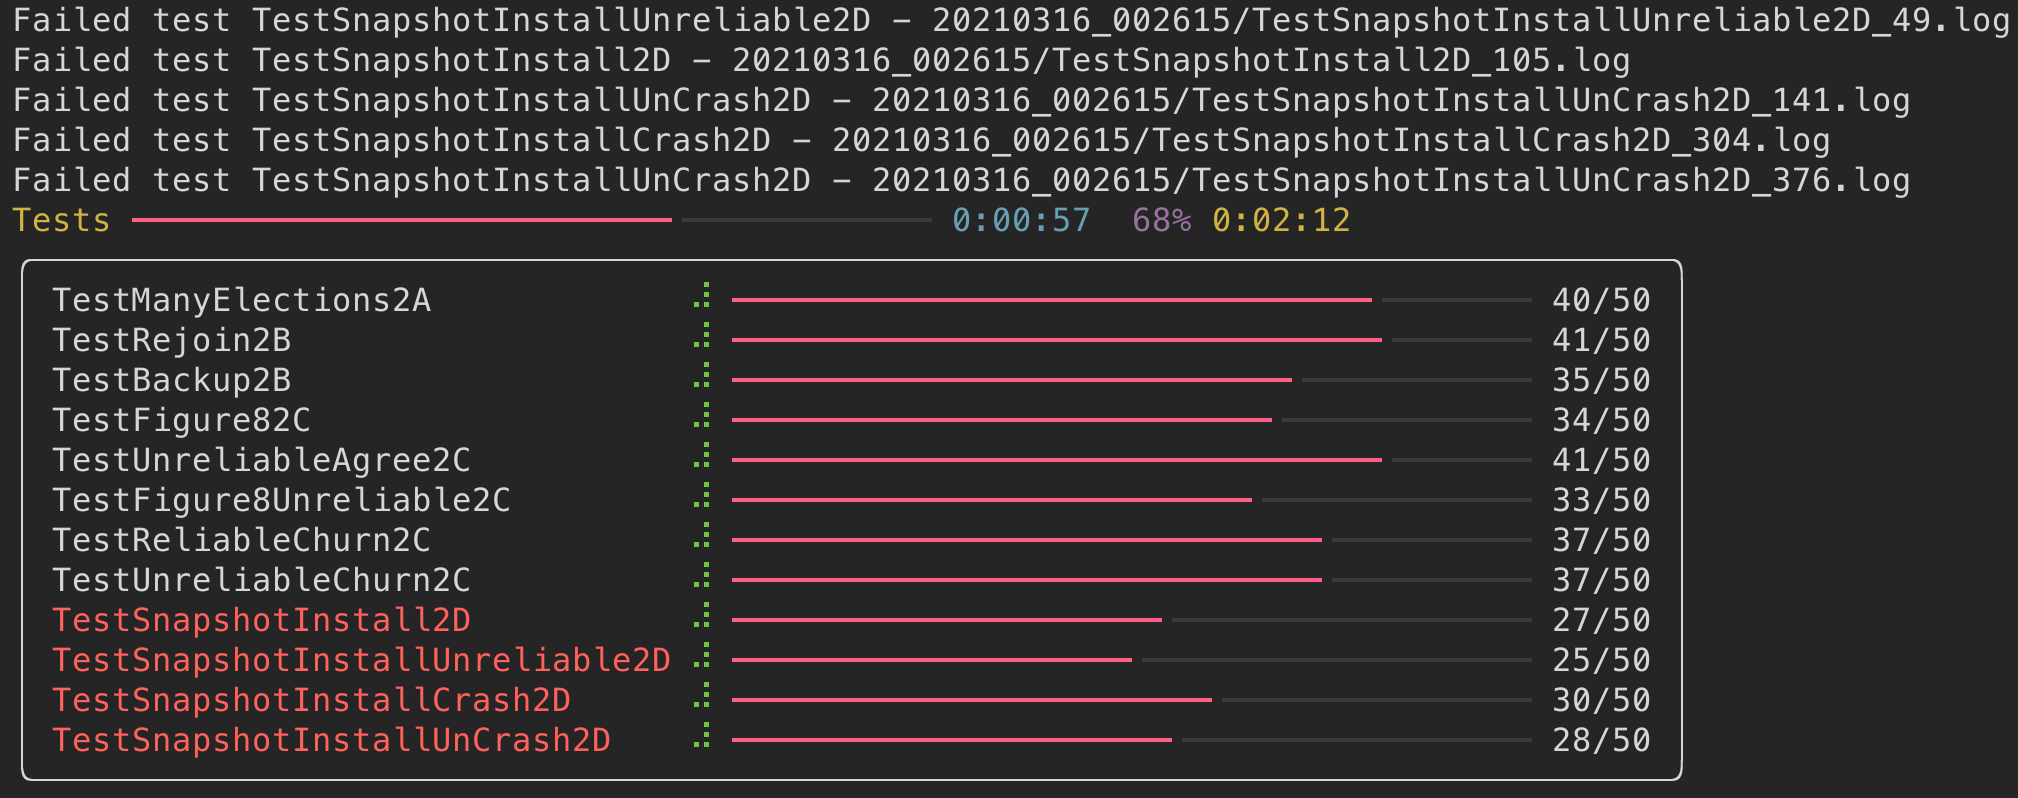
I dived into Rich again to get pretty looking progress bars and tables for the tests and I have to say that I’m quite happy with the result. This is how the script looks while it’s executing, with failed tests and logs reported as they appear:
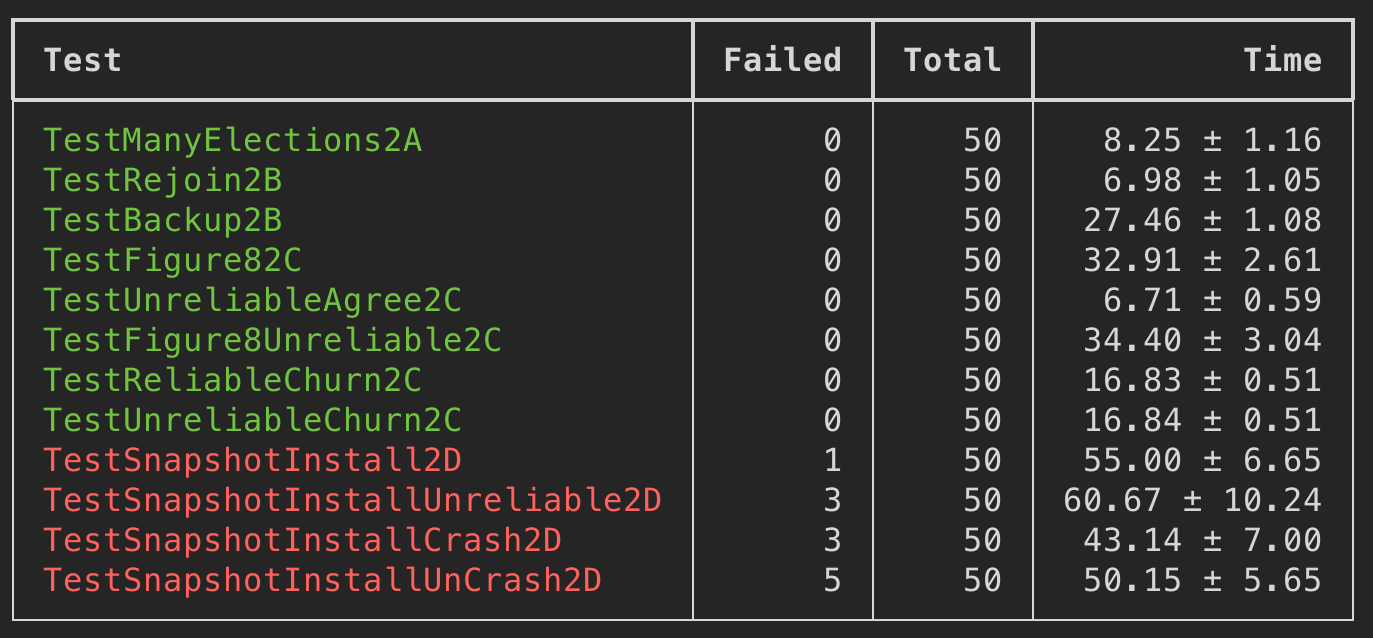
Once it’s done, we get a report of how many failed runs there were and the mean runtime per test. In the example below, there seems to be a rare issue with snapshots and we now have a dozen logs to debug it.
Now go build your own
I hope this overview was helpful and provided the background and illustrative examples for the building blocks required to implement beautiful yet functional terminal tools for debugging distributed code. Huge props to the developers of Rich, without it, building these tools would have been an order of magnitude more time-consuming.
Disclaimer: Truecolor Support
I do have to make a disclaimer about the color support required for the log parser script. Terminals support 8-bit colors by default in most cases. This 8-bit is for the whole color value so you get 256 colors in total. However, most UI color palettes such as text editors, support 8 bits for each channel, adding up to a total of 24-bits per color, leading to the common 16 million colors denomination.
Rich has names for all the 8-bit colors so you can use them instead of the RGB codes I use if you stick with a 8-bit color palette. On the other hand if you want to enable 24-bit color mode, you will want to search for truecolor support in your current tools. A large fraction of modern terminal tools do support the wider array of colors although sometimes it has to be manually enabled. Do note that for truecolor to work you need all moving pieces to support truecolor. This will vary from setup to setup, but usually means:
- Your terminal emulator, i.e. the GUI app that lets you access the terminal (usually one of Terminal.app, iTerm, GNOME Terminal, kitty, alacritty, Windows Terminal, &c). Most modern terminals support truecolor but sometimes they require that you specify the
TERMenvironment variable asxterm-256color. - Terminal multiplexers like
tmuxif you use one. Again, most likely supported but not the default behavior. Adding a few lines to your.tmux.confdoes the job. - Your remote client, if you are using one. This is usually
sshwhich in most cases should handle truecolor. If you use other options like mosh, Eternal Terminal or (PuTTY, you’ll need to check. - If your vim/neovim is looking sad with only 256 colors you might also want to consider enabling truecolor there.